MindMup measures make it easy to visualise and manage values on a mind map, such as money, time and effort. Measures on a map can help you in planning, budgeting and controlling a hierarchical breakdown of budgets or tasks.
Enabling measurements for a map
To start working with measurements on a map, select View > Sidebar> Show Measurements from the top menu, or just press the M key while working on a map. This will divide the screen into two panels, and show the measurements in the right half. You can hide the measurements by pressing M again, by selecting View > Sidebar > Hide sidebar from the menu.
If your screen space works better with a vertical split, you can also move the measurements panel below the map instead of showing it on the right side, by selecting View > Sidebar > Vertical split. To make measures appear on the right side again, select View > Sidebar > Horiozontal Split.
While the measurements sidebar is active, you’ll also see a new top menu, Measurements. Use the options from that menu to add and remove measurements from your map.
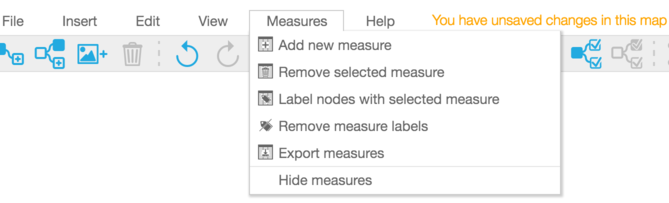
You can also use the buttons with the measurements icons in the main toolbar.
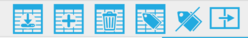
Hover over a tool to see the functions. From left to right, the toolbar buttons provide the following functions:
- Download measurements as a spreadsheet
- Add a measurement
- Remove the selected measurement
- Set selected measurement as a label on the map
- Remove the active measurement labels
- Hide sidebar
Working with the measures sidebar
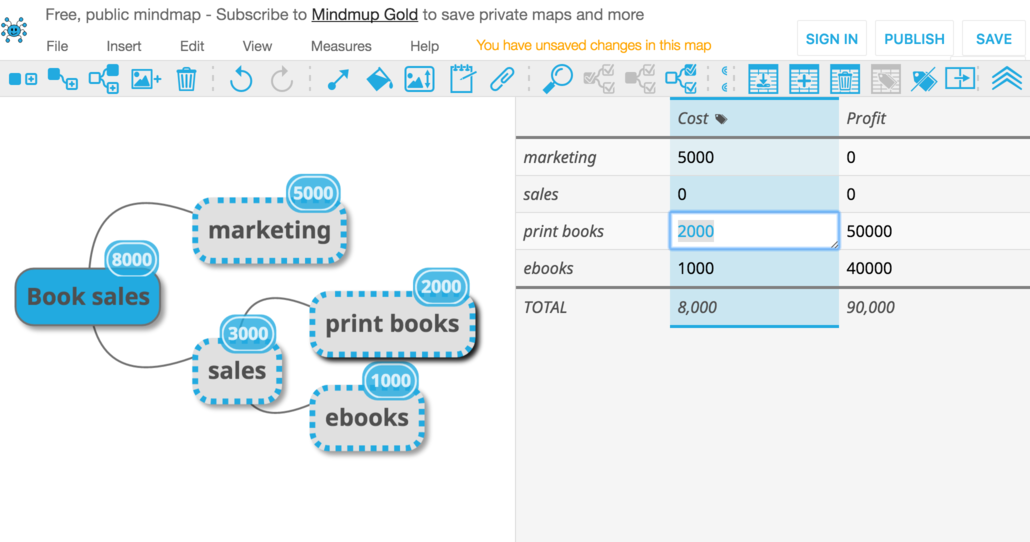
The measure panel works as a spreadsheet - it will show the map measures for currently selected nodes on the left hand side. The first time you open the panel on a map it will show a blue hint on how to add measures. To add a new measure to the map, just select Measurements > Add new measure from the main menu, or tap on the Add a measurement button in the toolbar.
Adding a measure will hide the initial help text and show the spreadsheet with the measure values for the currently selected map nodes. You can move around the map on the left to select different nodes to show in the spreadsheet. To select multiple nodes, use shift+click. You can also use Shift and arrow keys to select adjacent nodes, and press any number on the keyboard to select an entire level (eg press 1 to select all children of the root node). There are many other hotkeys for selecting nodes, see the Keyboard shortcuts page to learn about them. Click on any cell in the spreadsheet to edit it, and enter some values for your measures.
You can add several measurements to the same map, and they will show in a spreadsheet. To remove a measurement, click on the measurement name in the spreadsheet header, and select Remove Measurement in the drop-down menu that opens.
As you change the measurement values, the bottom column (TOTAL) will show the sum of all the selected measures. This allows you to easily see subtotals for different parts of your map, and compare different measurements such as estimated and actual costs. remember that the panel only shows selected nodes, not the entire map. To get an overview of the entire map in the spreadsheet, click the root node and select all it’s children (Edit > Select > Subtree) or press the { key.
To perform calculations on numbers in a real spreadsheet, select Measures > Export Measures. This will download a tab separated text file with the selected measurements, which you can then open in Excel or any other spreadsheet program.
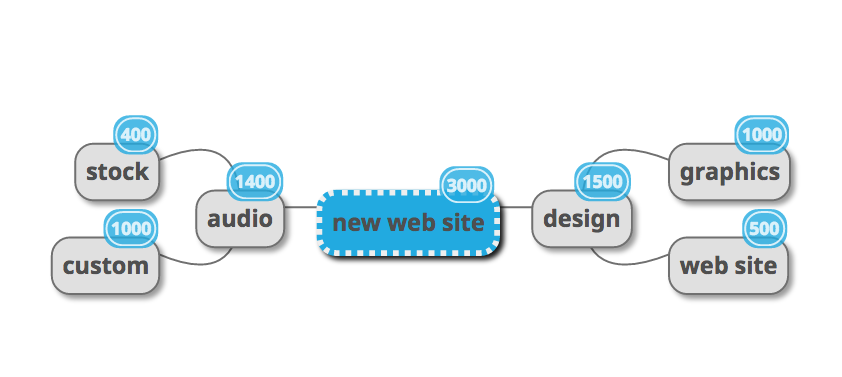
If you want to show the totals for the entire map visually, there is an even better way. Select one of the measurement columns, and then Measures > Label nodes with selected measure. This will show the totals for all nodes, adding up children values to parents, for the selected measurement on a map. The labels overview is designed to provide you with quick information on the total cost, or total estimated days for a project. You can change the label shown on the map from the labels drop down, or hide the labels.
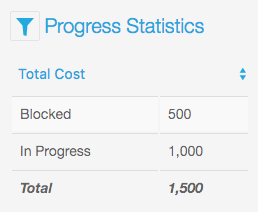
For more detailed breakdowns and statistics, use the Progress sidebar, and assign different statuses to your map nodes. The progress stats menu will contain two items for each measure – Total and Percentage. Choosing one of them will show a quick overview by status types. You can use this to find out how much money you need to save for future projects, how many test cases are still pending and so on.